Rechercher


Accueil > La Recherche > Axes & Equipes > Matière Molle & Verres > Equipe : Physique des Verres > Thème : Structure, vibration, relaxations dans les systèmes désordonnés
Ferroelectric relaxors
publié le , mis à jour le
Collaboration with J. Hlinka, Academy of Sciences of the Czech Republic Praha)
(P. Papet, J. Rouquette, and J. Haines, Institut Charles Gehrardt, Montpellier)
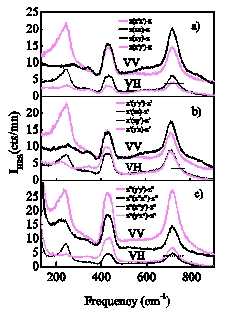
One major interest of Hyper-Raman is its high sensitivity to all polar vibrations including soft polar modes, and also to excitations that are inactive in both infrared absorption and Raman scattering. These specificities provide hyper-Raman with a very powerful tool for the investigation of the local and average structure of ferroelectric relaxors.
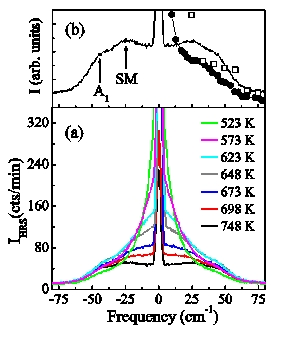
The hyper-Raman spectroscopy of three single crystals of the relaxor PbMg1/3Nb2/3O3 has been performed (A. Al-Zein et al, PRB 2008). The relative scattering intensities obtained for the band near 250 cm−1 in various polarization geometries are fully compatible with the hyper-Raman tensor of the F2u ‘silent’ mode of the parent Oh cubic structure (Fig. 1). The temperature dependence of the three F1u-symmetry polar modes was investigated between 20 K and 800 K. Some of the transverse (TO) and longitudinal (LO) components are splitted up to the highest temperatures, confirming the existence of local lattice distortions well above the Burns temperature Td ≈ 620 K. The splitting of the LO2-mode near 400 cm-1 strongly increases below Td, a behaviour which likely relates to the growth of the nanodomains. The soft TO-mode is also clearly observed, with a frequency decreasing to zero near Tb (Fig. 2). Same behaviours have been observed in another relaxor-type compound, PbMg1/3Ta2/3O3. Finally, a weak but clear transition-like anomaly in the temperature dependence of the lowest frequency LO-mode (LO1) is observed near the Curie temperature Tc=210 K.