Rechercher


Accueil > La Recherche > Axes & Equipes > Axes transverses > Graphène
Raman spectroscopy of epitaxial graphene on SiC
publié le
On SiC, the graphene growth depends strongly on the SiC surface reconstruction and the SiC surface orientation(on or off axis, Si or C face). This surface reconstruction yields to steps that can be up to 10 nm high. Such step heights combined with the fact that graphene can fully cover the SiC surface, prevent to measure the graphene thickness with AFM. It was then mandatory to develop a technique to measure the graphene thickness. Since the absorptance of the graphene increases proportionally with its thickness (in theory, 1.2 % of the incoming light is absorbed per graphene sheet on SiC substrates), we combined microRaman spectroscopy with micro-transmission experiments by inserting a low noise photodiode between the SiC substrate and the XYZ piezoelectric stage. Raman spectra are collected at room temperature, using a Jobin-Yvon Horiba T64000 spectrometer operated in the confocal mode with the 514 nm line of an Ar ion laser.
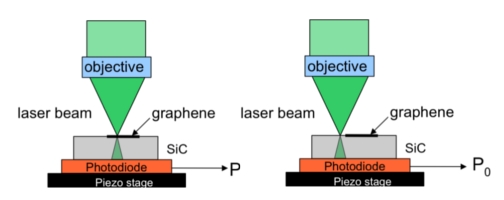
In this way, the power transmitted through the sample and the associated micro-Raman spectrum are measured at the same time, on the same point, using the same laser beam as a probe.
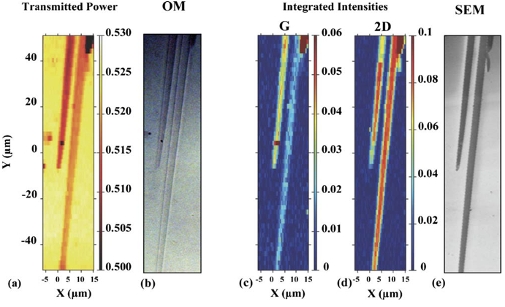
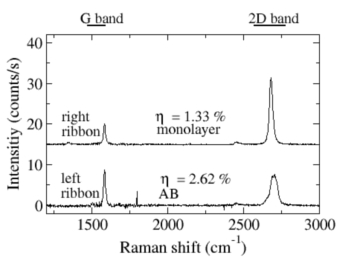
Transmission map and Raman integrated intensities maps (G and 2D bands) are compared to optical microscopy (OM) and scanning electron microscopy (SEM) images. We can clearly observe that the transmitted power is weaker through the two FLG ribbons shown on these maps because of the graphene absorptance. The spectra corresponding to this two neighbouring ribbons are shown in the following figure.